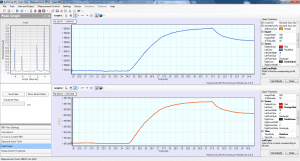
 BioSense™ is a data acquisition and evaluation software software that provides flexible control of measurement on OWLS™ instrument, data acquisition, analysis and storage.
Chemical and biochemical interactions can be followed and quantified in real-time, thus revealing the specificity, the dynamics and the strength of the reaction and the binding. The measurement and analysis are rapid and convenient.
The comprehensive database structure of BioSense software offers password protected user hierarchy and profile. Each measurement can be classified in projects and experiments. Several keywords, text fields allow detailed description of the measurement conditions . Sensor related data are also implemented in the database. All these measurement, sensor and user related data can serve as search condition in the database.
Control & Measurement
Real-time, high speed chemical or biomolecular interaction detection. The BioSense software performs full control of OWLS 210 instrument: stepping motor control, auto-range control of photocurrent measurement, temperature measurement, timing, auto-calibration of angle reference point etc.
Three measurement modes are available:
- PEAK: Measurement of incoupled light intensity versus angle of incidence of the laser light
- RIM: Continuous measurement of incoupling parameters, temperature, refractive index of cover medium, time resolution 1-3 sec.
- FLUCTUATION: Continuous photocurrent measurement at a fix angle of incidence of the laser light.
Options:
- EC-BioSense: Electrochemical software module
- Fluoro-BioSense: Fluorescence software module
- Control of automatic refractometer
- Control of syringe pump
Analyses
BioSense provides evaluation of sensing parameters from the measured incoupling angles by using appropriate optical models.
The calculated parameters are:
- Refractive index (nF), and thickness (dF)of the waveguiding film, self calibration of the sensor parameters
- Refractive indices of the cover medium (ncTE, ncTM)
- Refractive index (nA) and thickness (dA) of the adsorbed material
- Mass per square centimeter of the adsorbed layer
- Qualitative kinetic information (dM/dt versus M)
Visualization
The advanced graphing tool of BioSense provides continuous visualization of the measurements.
Multi-user Environment
The multi-user software environment provides password protected user profiles for personalized access and
custom settings for measurements.
Data Export
Measurement results and calculated values can be exported to popular charting and spreadsheet formats (Excel, Origin, etc.)

